
Literacy in Other Communities

Santa Barbara is far from the only place where reading scores are not where they should be or where community members are working together to make improvements. Read about how concerned citizens are joining forces to improve literacy throughout the Golden State and across the nation.
Picture3
California Reading Coalition
logo (2) 1
Oakland Literacy Coalition
logo1
San Diego Council on Literacy
sacliteracyfoundation_Logo
Sacramento Literacy Foundation

Publications focused on Education Issues

Learn what researchers have learned about how the brain learns to read—and how reading should be taught
image 2
Cal Matters
Rectangle 4
Education Week

Resources

Websites to help you support your child’s strengths and address their challenges.

Educator Resources

Compass-logo-final
The Reading League Compass
logo-sbreads
Moving the Needle on Childhood Literacy – English
logo-sbreads
Moving the Needle on Childhood Literacy – Spanish
rl
The Reading League California
EAC-Logo-Large
Mission Vision Values
ld_logo
Recommendations – (Other Blogs, Podcasts, Research and Resources)
images
Science of Reading – What I Should Have Learned in College

Parent Resources

rr
Reading Rockets
child
Children of the Code
colorin
Colorin Colorado
adlit
Adlit (For Adolescent Readers)
Rectangle 4
How to Gain Background Knowledge

Tools

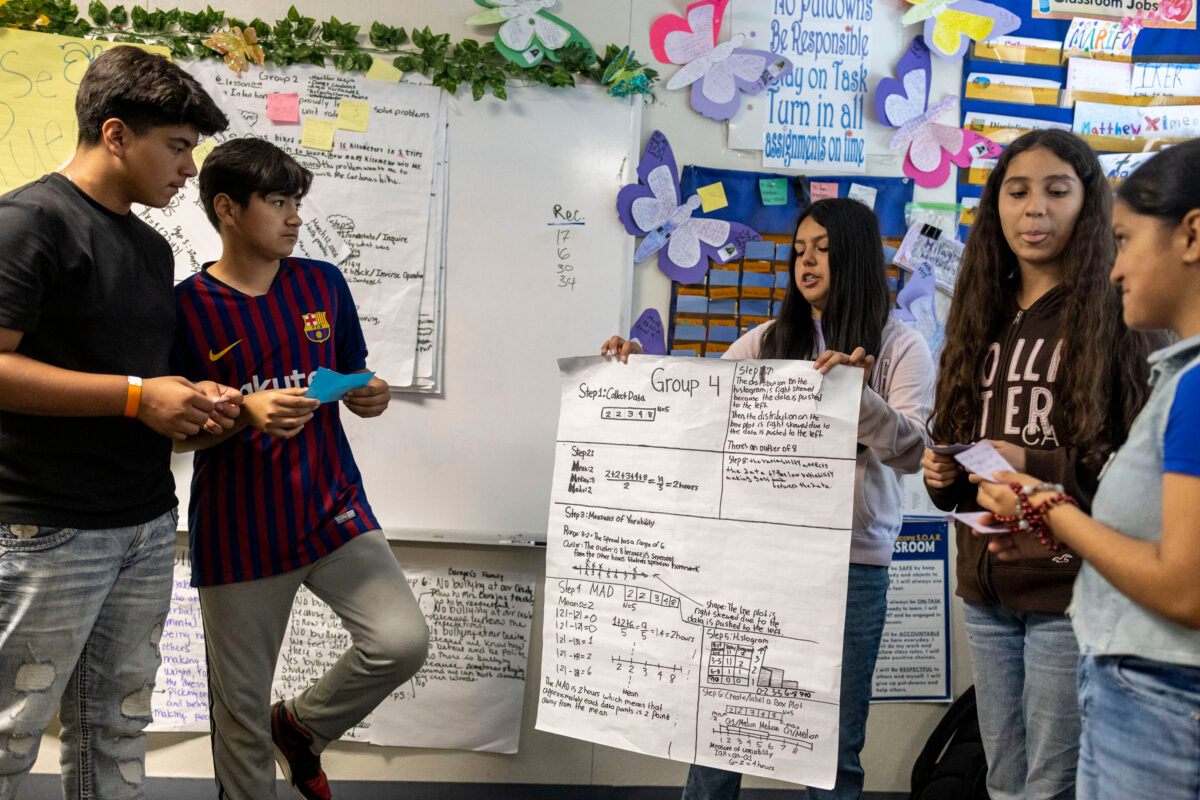
HOLD FOR STORY - Sixth graders practice giving a presentation during Nancy Barajas’ class at Fairview Elementary School on Wednesday, May 6, 2026 in Modesto, Calif. (AP Photo/Annie Barker)
Despite recent gains, California students continue to struggle with reading. Southern states offer lessons through phonics-based instruction, teacher support, and targeted interventions.
Reading scores have been falling across the U.S. since 2013, and most states are still struggling to recover. Only five states plus Washington D.C. saw real improvement in reading between 2022 and 2025, and California is not among them. The states that did improve share one thing in common: they switched to phonics-based reading instruction, an approach backed by decades of research on how kids actually learn to read. Southern states like Louisiana and Alabama were among the earliest to make that shift, and their results stand out nationally. Louisiana is the only state where both reading and math scores are higher now than before the pandemic. Detroit also shows what's possible when schools combine better reading instruction with a serious focus on getting kids to show up consistently. Researchers say this progress can happen everywhere, because we've done it before.
reading-curriculum-teachers
The Education Scorecard is a research website that tracks school district performance nationwide, highlighting academic trends, recovery progress, and districts improving in reading and math.
The Education Scorecard is a website that provides detailed information about academic performance in school districts across the United States. Developed through a collaboration between researchers at Harvard, Stanford, and Dartmouth, the site tracks student achievement in reading and math and highlights districts that are making significant improvements. Users can explore district-level data, compare performance trends, and learn about factors influencing student success. The website is beneficial because it helps to better understand how schools are performing and where improvements are occurring. It also helps identify successful strategies that other districts may be able to adopt. To use the website, visitors can search for specific school districts, view interactive maps and performance data, read national findings, and explore reports on high-performing districts. The site makes complex educational data more accessible and easier to understand for a broad audience.

Literacy News

Websites to help you support your child’s strengths and address their challenges.
qtq80-aszEtv
U.S. student test scores have dropped over the last decade. Use this interactive tool to look up how your school district has performed since 2015.
American students' math and reading scores have dropped over the last ten years, according to a new report from Stanford University. Researchers tracked test results for students in grades 3 through 8 across hundreds of school districts, comparing how each district performed in 2015 versus today. The results are mixed. Some districts have bounced back and improved, while others continue to fall behind. Los Angeles, for example, made meaningful gains but still scores below the national average. You can look up your own school district using the New York Times' interactive tool to see exactly how local scores have changed.
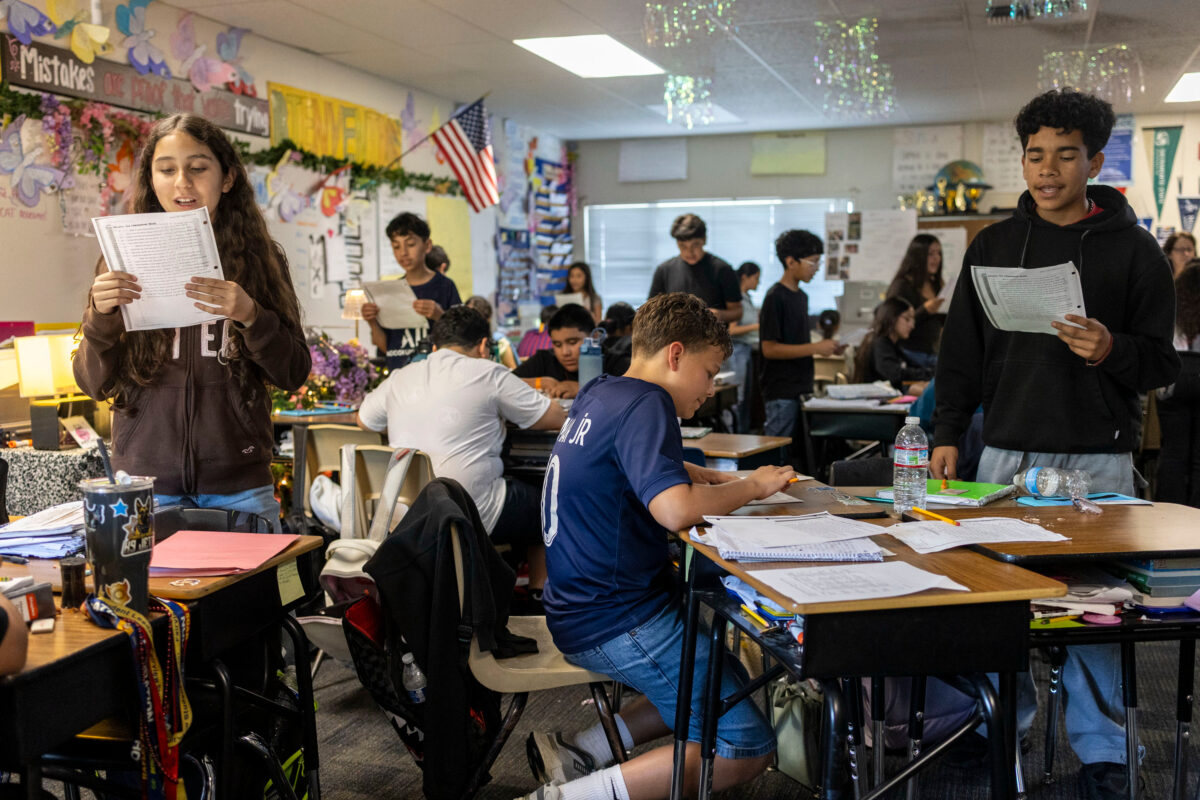
HOLD FOR STORY - Sixth graders read a passage and give constructive feedback to their partners during Nancy Barajas’ class at Fairview Elementary School on Wednesday, May 6, 2026 in Modesto, Calif. (AP Photo/Annie Barker)
California schools are working to reverse declining reading and math scores. Some districts are seeing strong improvements through teacher training, early support, and data-driven instruction.
While reading scores are falling in many schools across the country, some California districts are moving in a positive direction. Compton Unified and Modesto City Schools have seen steady improvements in both reading and math by catching struggling students early and getting them help quickly. Both districts hold regular meetings to review how students are doing and figure out who needs extra support. Teachers also receive ongoing training and work together to share what's working in the classroom. Researchers from Harvard, Stanford, and Dartmouth highlighted these districts as standout success stories in a study comparing more than 5,000 school districts. When schools stay consistent and pay close attention to how their students are doing, kids make real progress, even in communities facing big challenges.
Getty Images/Ridofranz
The science of reading has reshaped literacy instruction nationwide, but many classrooms still struggle to fully implement evidence-based reading practices and teacher training
Most schools and states have adopted reading programs based on phonics and research, but a new report finds that many teachers still aren't fully using these methods in the classroom. About one in three teachers still rely on older approaches that research has shown are less effective. One of the most concerning findings is that teachers who learned about reading instruction in college actually know less about it than those who picked it up on the job, suggesting that teacher training programs need serious improvement. States like Mississippi show that real change is possible, but it takes years of consistent effort, strong teacher training, and good curriculum. Passing laws and policies is a start, but what happens in the classroom every day is what truly matters for kids learning to read.
Jacob Stead for NPR
Student reading and math scores were declining before COVID, but some schools are seeing improvement through targeted support, literacy reforms, and evidence-based instruction.
Student test scores in reading and math have been dropping since around 2013, well before the COVID pandemic. Researchers point to two likely causes: schools facing less pressure to improve after federal accountability laws were loosened, and the rise of social media pulling students away from learning. The good news is that math scores are starting to recover in most states, and schools that have adopted research-backed reading methods, like teaching phonics, are seeing real improvement in reading too. Federal relief money also made a difference for schools in lower-income communities. Baltimore City schools are a standout example, with reading scores climbing sharply after the district committed early to evidence-based reading instruction. The bigger picture is that American schools made tremendous gains for two decades before the slide began, and researchers say we can get back on that track.

California Reading Report Card
CA Assessment of Student Performance and Progress (CAASPP)
For English Language Arts (ELA)

Percentage of local public school children that met the state reading standard
  • Adams  

    51.87% 66.1% SED, 32.4% EL

  • Cleveland  

    35.82% 83.5% SED, 47.6% EL

  • Harding University Partnership  

    48.93% 78.0% SED, 36.8% EL

  • Monroe  

    43.11% 69.2% SED, 22.5% EL

  • Roosevelt  

    53.99% 55.3% SED, 15.1% EL

  • Santa Barbara Charter  

    59.09% 24.5% SED, 4.8% EL

  • Adelante Charter  

    52.44% 71.9% SED, 43.8% EL

  • Franklin  

    50.62% 91.3% SED, 31.4% EL

  • McKinley  

    20.63% 82.6% SED, 50.2% EL

  • Peabody Charter  

    71.42% 42.7% SED, 9.7% EL

  • Santa Barbara Community Academy  

    32.58% 86.4% SED, 44.8% EL

  • Washington  

    62.06% 41.7% SED, 8.6% EL

51.88% Met or Exceeded Standard for ELA
X

Adams

51.87%
Met or Exceeded Standard for ELA
English Language Arts/Literacy Percentage
Standard Not Met (Level 1) 26%
Standard Nearly Met (Level 2) 24%
Standard Met (Level 3) 27%
Standard Exceeded (Level 4) 23%
X

Cleveland

35.82%
Met or Exceeded Standard for ELA
English Language Arts/Literacy Percentage
Standard Not Met (Level 1) 40%
Standard Nearly Met (Level 2) 32%
Standard Met (Level 3) 18%
Standard Exceeded (Level 4) 10%
X

Harding University Partnership

48.93%
Met or Exceeded Standard for ELA
English Language Arts/Literacy Percentage
Standard Not Met (Level 1) 34%
Standard Nearly Met (Level 2) 26%
Standard Met (Level 3) 24%
Standard Exceeded (Level 4) 16%
X

Monroe

43.11%
Met or Exceeded Standard for ELA
English Language Arts/Literacy Percentage
Standard Not Met (Level 1) 31%
Standard Nearly Met (Level 2) 25%
Standard Met (Level 3) 29%
Standard Exceeded (Level 4) 15%
X

Roosevelt

53.99%
Met or Exceeded Standard for ELA
English Language Arts/Literacy Percentage
Standard Not Met (Level 1) 25%
Standard Nearly Met (Level 2) 23%
Standard Met (Level 3) 25%
Standard Exceeded (Level 4) 27%
X

Santa Barbara Charter

59.09%
Met or Exceeded Standard for ELA
English Language Arts/Literacy Percentage
Standard Not Met (Level 1) 19%
Standard Nearly Met (Level 2) 30%
Standard Met (Level 3) 32%
Standard Exceeded (Level 4) 19%
X

Adelante Charter

52.44%
Met or Exceeded Standard for ELA
English Language Arts/Literacy Percentage
Standard Not Met (Level 1) 33%
Standard Nearly Met (Level 2) 28%
Standard Met (Level 3) 20%
Standard Exceeded (Level 4) 19%
X

Franklin

50.62%
Met or Exceeded Standard for ELA
English Language Arts/Literacy Percentage
Standard Not Met (Level 1) 22%
Standard Nearly Met (Level 2) 27%
Standard Met (Level 3) 31%
Standard Exceeded (Level 4) 20%
X

McKinley

20.63%
Met or Exceeded Standard for ELA
English Language Arts/Literacy Percentage
Standard Not Met (Level 1) 50%
Standard Nearly Met (Level 2) 29%
Standard Met (Level 3) 17%
Standard Exceeded (Level 4) 4%
X

Peabody Charter

71.42%
Met or Exceeded Standard for ELA
English Language Arts/Literacy Percentage
Standard Not Met (Level 1) 13%
Standard Nearly Met (Level 2) 16%
Standard Met (Level 3) 26%
Standard Exceeded (Level 4) 45%
X

Santa Barbara Community Academy

32.58%
Met or Exceeded Standard for ELA
English Language Arts/Literacy Percentage
Standard Not Met (Level 1) 39%
Standard Nearly Met (Level 2) 28%
Standard Met (Level 3) 23%
Standard Exceeded (Level 4) 10%
X

Washington

62.06%
Met or Exceeded Standard for ELA
English Language Arts/Literacy Percentage
Standard Not Met (Level 1) 19%
Standard Nearly Met (Level 2) 22%
Standard Met (Level 3) 22%
Standard Exceeded (Level 4) 37%
  • Adams
  • Cleveland
  • Harding University Partnership
  • Monroe
  • Roosevelt
  • Santa Barbara Charter
  • Adelante Charter
  • Franklin
  • McKinley
  • Peabody Charter
  • Santa Barbara Community Academy
  • Washington
  • Adams  

    51.87% 66.1% SED, 32.4% EL

  • Cleveland  

    35.82% 83.5% SED, 47.6% EL

  • Harding University Partnership  

    48.93% 78.0% SED, 36.8% EL

  • Monroe  

    43.11% 69.2% SED, 22.5% EL

  • Roosevelt  

    53.99% 55.3% SED, 15.1% EL

  • Santa Barbara Charter  

    59.09% 24.5% SED, 4.8% EL

  • Adelante Charter  

    52.44% 71.9% SED, 43.8% EL

  • Franklin  

    50.62% 91.3% SED, 31.4% EL

  • McKinley  

    20.63% 82.6% SED, 50.2% EL

  • Peabody Charter  

    71.42% 42.7% SED, 9.7% EL

  • Santa Barbara Community Academy  

    32.58% 86.4% SED, 44.8% EL

  • Washington  

    62.06% 41.7% SED, 8.6% EL

  • Adams  

    49.13% 77% SED, 26% EL

  • Cleveland  

    28.35% 84% SED, 45% EL

  • Harding University  
    Partnership

    40.51% 81% SED, 37%

  • Monroe  

    44.17% 74% SED, 19% EL

  • Roosevelt  

    52.37% 57% SED, 11% EL

  • Santa Barbara Charter  

    51.37% 27% SED, 0% EL

  •   Adelante Charter

    39.38% 74% SED, 27% EL

  •   Franklin

    50.79% 95% SED, 32% EL

  •   McKinley

    20.80% 93% SED, 50% EL

  •   Peabody Charter

    70.37% 46% SED, 8% EL

  •   Santa Barbara
    Community Academy

    33.34% 90% SED, 38% EL

  •   Washington

    58.82% 55% SED, 9% EL

49.44% Met or Exceeded Standard for ELA

SED: Socioeconomically Disadvantaged
EL: English Learner

X

Adams

49.13%
Met or Exceeded Standard for ELA
English Language Arts/Literacy Percentage
Standard Not Met (Level 1) 26%
Standard Nearly Met (Level 2) 24%
Standard Met (Level 3) 27%
Standard Exceeded (Level 4) 23%
X

Cleveland

28.35%
Met or Exceeded Standard for ELA
English Language Arts/Literacy Percentage
Standard Not Met (Level 1) 40%
Standard Nearly Met (Level 2) 32%
Standard Met (Level 3) 18%
Standard Exceeded (Level 4) 10%
X

Franklin

50.79%
Met or Exceeded Standard for ELA
English Language Arts/Literacy Percentage
Standard Not Met (Level 1) 22%
Standard Nearly Met (Level 2) 27%
Standard Met (Level 3) 31%
Standard Exceeded (Level 4) 20%
X

McKinley

20.80%
Met or Exceeded Standard for ELA
English Language Arts/Literacy Percentage
Standard Not Met (Level 1) 50%
Standard Nearly Met (Level 2) 29%
Standard Met (Level 3) 17%
Standard Exceeded (Level 4) 4%
X

Monroe

44.17%
Met or Exceeded Standard for ELA
English Language Arts/Literacy Percentage
Standard Not Met (Level 1) 31%
Standard Nearly Met (Level 2) 25%
Standard Met (Level 3) 29%
Standard Exceeded (Level 4) 15%
X

Roosevelt

52.37%
Met or Exceeded Standard for ELA
English Language Arts/Literacy Percentage
Standard Not Met (Level 1) 25%
Standard Nearly Met (Level 2) 23%
Standard Met (Level 3) 25%
Standard Exceeded (Level 4) 27%
X

Washington

58.82%
Met or Exceeded Standard for ELA
English Language Arts/Literacy Percentage
Standard Not Met (Level 1) 19%
Standard Nearly Met (Level 2) 22%
Standard Met (Level 3) 22%
Standard Exceeded (Level 4) 37%
X

Adelante Charter

39.38%
Met or Exceeded Standard for ELA
English Language Arts/Literacy Percentage
Standard Not Met (Level 1) 33%
Standard Nearly Met (Level 2) 28%
Standard Met (Level 3) 20%
Standard Exceeded (Level 4) 19%
X

Peabody Charter

70.37%
Met or Exceeded Standard for ELA
English Language Arts/Literacy Percentage
Standard Not Met (Level 1) 13%
Standard Nearly Met (Level 2) 16%
Standard Met (Level 3) 26%
Standard Exceeded (Level 4) 45%
X

Santa Barbra charter

51.37%
Met or Exceeded Standard for ELA
English Language Arts/Literacy Percentage
Standard Not Met (Level 1) 19%
Standard Nearly Met (Level 2) 30%
Standard Met (Level 3) 32%
Standard Exceeded (Level 4) 19%
X

Santa Barbara Community Academy

33.34%
Met or Exceeded Standard for ELA
English Language Arts/Literacy Percentage
Standard Not Met (Level 1) 39%
Standard Nearly Met (Level 2) 28%
Standard Met (Level 3) 23%
Standard Exceeded (Level 4) 10%
X

Harding University Partnership

40.51%
Met or Exceeded Standard for ELA
English Language Arts/Literacy Percentage
Standard Not Met (Level 1) 34%
Standard Nearly Met (Level 2) 26%
Standard Met (Level 3) 24%
Standard Exceeded (Level 4) 16%
  • Adams
  • Adelante
  • Cleveland
  • Franklin
  • Harding University Partnership
  • McKinley
  • Monroe
  • Peabody
  • Roosevelt
  • Santa Barbara Community Academy
  • Santa Barbara Charter
  • Washington

Elementary School English Language Arts Test Scores Grouped by Similar Demographics.

Source: California Department of Education

Meet or Exceed State StandardSocio-Economic Disadvantaged Students
(% of population)
English Learners
(% of population)
PEABODY*71.4342.79.7
ROOSEVELT 53.3955.315.1
WASHINGTON**63.0641.78.6
SB CHARTER59.0924.54.8
ADAMS51.8766.132.4
MONROE 43.1169.222.5
ADELANTE *** 52.4471.943.8
FRANKLIN50.6291.331.4
HARDING ****48.9378.036.8
CLEVELAND35.8283.547.6
SB COMMUNITY ACADEMY32.5886.444.8
MCKINLEY*****20.6382.650.2
* PEABODY Implemented Science of Reading instruction and teacher training (LETRS) training in 2022
**WASHINGTON Hosts GATE Magnet Program
***ADELANTE Dual Immersion program (TWI: Two-Way Immersion)
****HARDING University Partnership with UCSB Gevirtz School of Education, McEnroe Reading Clinic
***** MCKINLEY Dual Immersion program (META: Multilingual Excellence Transforming Achievement)

Test Score Data

score1

California Smarter Balanced Test Results: 2023

score3

Santa Barbara ELA and Mathematics

score2

California Reading Coalition – California District data

Making the switch from balanced literacy to the Science of Reading is far more than a curriculum change, it is a paradigm shift. Most of our educators did not have the benefit of learning that the brain is not naturally wired to read, and how reading is most optimally taught. It is a complex process that requires experienced, informed leadership and a commitment to the time and support required for successful implementation. Here is a collection of districts that feature literacy leaders who are changing school cultures by changing curriculum.
Mississippi - Sbreads
The Mississippi Miracle
In 2019, the perennially low-achieving state of Mississippi was the only state in the nation where students made significant improvement in their reading scores in nationwide testing. It was the culmination of a decade committed to transforming how reading was taught throughout the state. And how teachers were retrained in best practices grounded in science.

The success seen there has many implications for the rest of the country.

Through strong partnerships forged from the school district level all the way up to the governor’s office, literacy leaders worked together to develop a multi-pronged approach to improve literacy instruction. The massive effort required significant financial investment, a multi-year commitment to effective implementation, and buy-in from the education community. The across-the-board success for all students including low-income, Black and Hispanic offers lessons that have made educators across the nation sit up and take notice, and in many cases, adopt a similar approach.
Screenshot_1
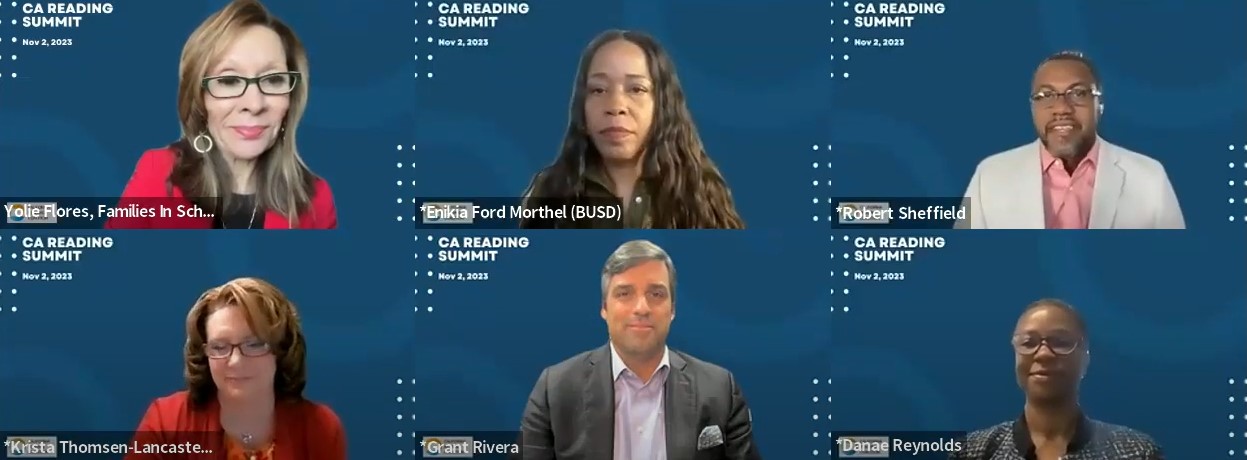
Panel Discussion: School Districts on the Move
A video presentation from the 2023 California Reading Summit focused on literacy leaders from districts with diverse student populations throughout the state. Panelists emphasize a multi-year, multi-pronged approach to the implementation of the Science of Reading.

The notion of teaching reading as a moral imperative and an equity issue is especially emphasized, as well as the adoption of appropriate curriculum, and the creation of systematic, long-lasting institutional change.

The speakers are not only knowledgeable about literacy, they show great empathy for the learning curve required for students, professional development for educators and partnering with community members and families. Their comprehensive approach is fresh, informed and essential.
Screenshot_2
Literacy is a Human Rights Issue for the 21st Century
Dr. Tracy White Weeden, CEO of the Neuhaus Education Center in Houston, is a nationally known expert in reading instruction. Her presentation to the California Dyslexia Initiative in 2023 provides a comprehensive and compassionate vision of the importance of literacy in every child’s life, why foundational reading skills are an essential component for the road to success, and what can happen when they are not taught—both on an individual and a societal level.
early literacy
Palo Alto Unified School District
Two great California cities Palo Alto and Santa Barbara, are known around the world. The expectation of both is that community members are very wealthy, that most students in public schools are high achieving and that the schools offer among the best instructional approaches in the nation.

But for years, both Palo Alto and Santa Barbara’s school districts grappled with the “achievement gap” and posted test scores in reading far proficiency far below what might be expected, particularly for low-income Latino students. Not coincidentally, both districts relied on the curriculum known as Lucy Calkins Units of Study with the now-discredited instructional approach known as “balanced literacy.”
School board member Todd Collins details how Palo Alto turned things around.
Peabody-School-vid-still-2022
Peabody Charter School
The public school with the top reading scores in Santa Barbara is Peabody Charter School, at 71 percent proficiency. A few years ago, the school’s leadership decided to make a significant investment developing clear strategies to accomplish the goal of every third-grader reading by 2026; and it has paid off. They ended instruction in “balanced literacy,” embraced the in the Science of Reading and provided the two-year intensive LETRS training for its teachers.

Learn more about their approach to the successful implementation of the Science of Reading in this article by Principal Demien Barnett.
a-z-schoolwide-2
Reading Rockets – Characteristics of Districts Making Improvements

Podcasts

Learn what researchers have learned about how the brain learns to read—and how reading should be taught.
background-1000px
Emily Hanford Sold A Story
ab67656300005f1f67282f44982a1c931dac8204
Leading Literacy, from the Los Angeles County Office of Education
podcast square apple podcasts
A Novel Idea (From the Iowa Reading Research Center)
A_Podcasts_Cover-SOR2023
Science of Reading

Videos of Note

Great resources to view.

Literacy advocate Kareem Weaver’s YouTube channel

Literacy How—a collection of valuable videos

NPR Report 1/1/24


Reading Rockets Literacy Channel

NBC report on Reading Crisis from Mississippi

How the brain learns to read—Animated video

Literacy How—a collection of valuable videos

Literacy advocate Kareem Weaver’s YouTube channel

Reading as a Human Right featuring John Corcoran, educator who learned to read in his 40s

Clips and Conversation about “The Right to Read,” moderated by former SBUSD school board member Ruth Green, along with Kareem Weaver and Emily Hanford

LeVar Burton and Jenny MacKenzie discuss their documentary, “The Right to Read” on CBS Mornings. Note: The film debuted at the Santa Barbara international Film Festival in February, 2023.

Newsletter Publications

reading-curriculum-teachers

The Education Scorecard is a research website that tracks school district performance nationwide, highlighting academic trends, recovery progress, and districts improving in reading and math.

The Education Scorecard is a website that provides detailed information about academic performance in school districts across the United States. Developed through a collaboration between researchers at Harvard, Stanford, and Dartmouth, the site tracks student achievement in reading and math and highlights districts that are making significant improvements. Users can explore district-level data, compare performance trends, and learn about factors influencing student success. The website is beneficial because it helps to better understand how schools are performing and where improvements are occurring. It also helps identify successful strategies that other districts may be able to adopt. To use the website, visitors can search for specific school districts, view interactive maps and performance data, read national findings, and explore reports on high-performing districts. The site makes complex educational data more accessible and easier to understand for a broad audience.

Author:

HOLD FOR STORY - Sixth graders practice giving a presentation during Nancy Barajas’ class at Fairview Elementary School on Wednesday, May 6, 2026 in Modesto, Calif. (AP Photo/Annie Barker)

Despite recent gains, California students continue to struggle with reading. Southern states offer lessons through phonics-based instruction, teacher support, and targeted interventions.

Reading scores have been falling across the U.S. since 2013, and most states are still struggling to recover. Only five states plus Washington D.C. saw real improvement in reading between 2022 and 2025, and California is not among them. The states that did improve share one thing in common: they switched to phonics-based reading instruction, an approach backed by decades of research on how kids actually learn to read. Southern states like Louisiana and Alabama were among the earliest to make that shift, and their results stand out nationally. Louisiana is the only state where both reading and math scores are higher now than before the pandemic. Detroit also shows what's possible when schools combine better reading instruction with a serious focus on getting kids to show up consistently. Researchers say this progress can happen everywhere, because we've done it before.

Author:

Jacob Stead for NPR

Student reading and math scores were declining before COVID, but some schools are seeing improvement through targeted support, literacy reforms, and evidence-based instruction.

Student test scores in reading and math have been dropping since around 2013, well before the COVID pandemic. Researchers point to two likely causes: schools facing less pressure to improve after federal accountability laws were loosened, and the rise of social media pulling students away from learning. The good news is that math scores are starting to recover in most states, and schools that have adopted research-backed reading methods, like teaching phonics, are seeing real improvement in reading too. Federal relief money also made a difference for schools in lower-income communities. Baltimore City schools are a standout example, with reading scores climbing sharply after the district committed early to evidence-based reading instruction. The bigger picture is that American schools made tremendous gains for two decades before the slide began, and researchers say we can get back on that track.

Author:

Getty Images/Ridofranz

The science of reading has reshaped literacy instruction nationwide, but many classrooms still struggle to fully implement evidence-based reading practices and teacher training

Most schools and states have adopted reading programs based on phonics and research, but a new report finds that many teachers still aren't fully using these methods in the classroom. About one in three teachers still rely on older approaches that research has shown are less effective. One of the most concerning findings is that teachers who learned about reading instruction in college actually know less about it than those who picked it up on the job, suggesting that teacher training programs need serious improvement. States like Mississippi show that real change is possible, but it takes years of consistent effort, strong teacher training, and good curriculum. Passing laws and policies is a start, but what happens in the classroom every day is what truly matters for kids learning to read.

Author:

HOLD FOR STORY - Sixth graders read a passage and give constructive feedback to their partners during Nancy Barajas’ class at Fairview Elementary School on Wednesday, May 6, 2026 in Modesto, Calif. (AP Photo/Annie Barker)

California schools are working to reverse declining reading and math scores. Some districts are seeing strong improvements through teacher training, early support, and data-driven instruction.

While reading scores are falling in many schools across the country, some California districts are moving in a positive direction. Compton Unified and Modesto City Schools have seen steady improvements in both reading and math by catching struggling students early and getting them help quickly. Both districts hold regular meetings to review how students are doing and figure out who needs extra support. Teachers also receive ongoing training and work together to share what's working in the classroom. Researchers from Harvard, Stanford, and Dartmouth highlighted these districts as standout success stories in a study comparing more than 5,000 school districts. When schools stay consistent and pay close attention to how their students are doing, kids make real progress, even in communities facing big challenges.

Author:

qtq80-aszEtv

U.S. student test scores have dropped over the last decade. Use this interactive tool to look up how your school district has performed since 2015.

American students' math and reading scores have dropped over the last ten years, according to a new report from Stanford University. Researchers tracked test results for students in grades 3 through 8 across hundreds of school districts, comparing how each district performed in 2015 versus today. The results are mixed. Some districts have bounced back and improved, while others continue to fall behind. Los Angeles, for example, made meaningful gains but still scores below the national average. You can look up your own school district using the New York Times' interactive tool to see exactly how local scores have changed.

Author:

"Once you learn to read you will forever be free"

Frederick Douglass

Get Involved

Your support can change the future of our children. Join us today.

Sign the Charter

Sign the Charter and become part of a movement to make lasting, impactful change in our schools and communities.

Name

Join Now

Name